Marinella Matejcic, Croatia, SSH Blog Correspondent
 Today, information is everything. The possibilities are endless: by using your computer, you can check the weather in a village behind the seven seas, read about growing carrots in a jar or, in some countries, check what’s the crime ratio in your neighborhood by clicking a couple of icons.
Yes, the last one is the topic of today’s blog post: is it possible to map violence? Sure it is. You just have to know how and where to look for the data.
In the early spring of 2015, a group of volunteers from two organisations – Hollaback Croatia and Code for Croatia – decided to join their forces to produce a website that would deliver information on the numbers of different crimes that happen in the Republic of Croatia. The initiative is aware that there is a strict and proper frame for combating violence in the family or the workplace, but that does not stand for street violence and/or harassment. They’ve recognized the possibilities of technology and wanted to change things. “The initiative works with zero funds and on the entirely voluntarily basis” – Miroslav Schlossberg from Code from Croatia told us.
One of the goals of the project was to raise the transparency of work of the bodies of public and state administration. As Croatia has a good Law on the right to access information and the Ministry of the Interior is open to cooperation, they started collecting information on crimes that occurred in the last five years. Ana Maria Filipovic Grcic, a volunteer from Hollaback Croatia said, that the idea itself was nothing new: similar things already exist in other countries. Per instance, India has the most criminal maps like the Croatian team is developing, except that they’ve already made an app that refreshes the data in real time. After all, India, unfortunately, is one of the countries with highest sexual violence and harassment ratio, and this is one of the ways that the community decided to fight it.
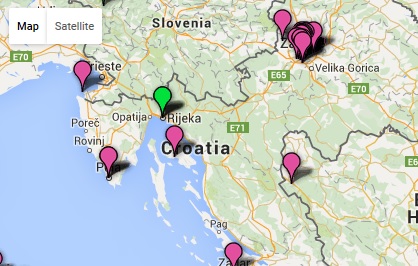
Hollaback! Croatia is already mapping citizen’s personal experience of harassment in public space. The team that develops Croatian application believes that by joining more sources of data (the official ones, from the police, and the data submitted by citizens) they will be able to provide a more reliable service. For that matter, they are collecting the general data, without names and details, just plain facts: when and where, and what the qualification of the crime is from both the Ministry and the citizens. The initiative is interested to find out how often do the particular crimes occur and what is the general safety level of the cities they are collecting the data for.
By mapping and providing the information on the crime rates in the capital of Croatia, Zagreb, and the rest of the country, it would be easier to learn what the real problems are and why is that violence happening after all. With an information sheet like that, it would be possible to conclude what can be done by the municipalities, do prevent the crimes from happening. It is important to highlight that the a map like this would help break the stereotypes on some neighbourhoods’ reputations and to show that the attacks are happening all over the country, and it’s not related to the time of the day and a particular public space.
The biggest part of the project is carried by the expert group Code for Croatia with help from the HollaBack initiative. There are five people on the team, but they are always looking for an extra pair of hands and a source of reliable financing. Mapping the violence is a significant joint project, which is a substantial evidence that, for starters, good will, time and experience really can change the world.
Marinella is a freelance journalist/writer, feminist activist, and soon-to-be administrative law student. She writes for Croatian portal on gender, sex and democracy called Libela.org and covers CEE stories for globalvoicesonline.org. Follow her on Twitter @mmatejci.
